Millions of statistics
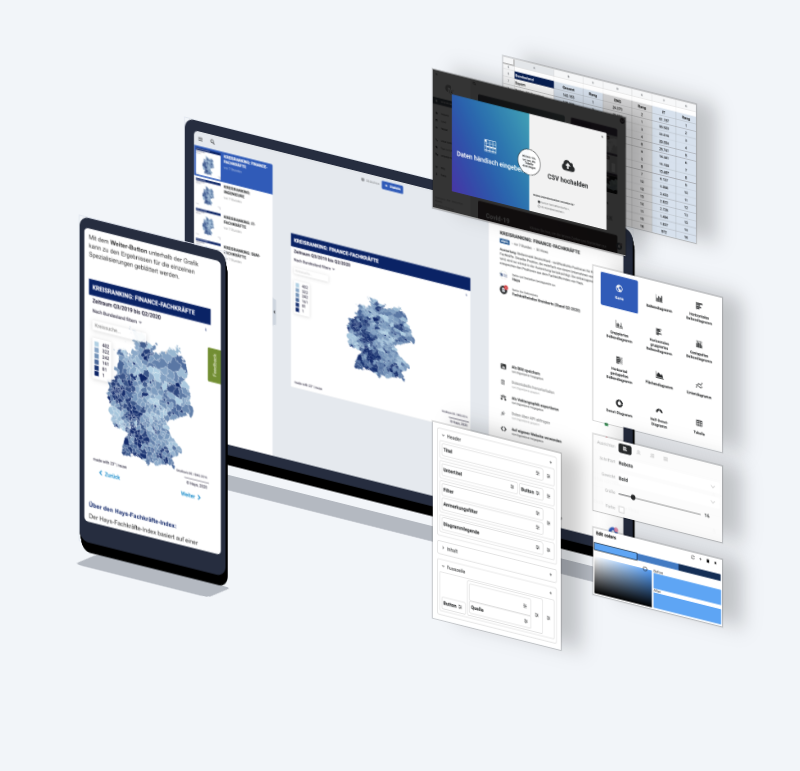
We developed a data platform enabling both manual and automated creation of data visualizations, designed to be seamlessly embedded into websites.
This platform efficiently handles over 100 million requests daily, serving more than a million users. It features robust ETL processes for programmatically extracting, transforming, and loading thousands of datasets from various free statistics portals.
These datasets automatically update or generate new visualizations.
Our team meticulously designed and implemented the necessary ETL processes, data models, databases, data governance structures, and validation systems.
We also developed an advanced tagging system incorporating integrated speech recognition, named entity recognition, topic classification, and geographic classification.
Additionally, we created a semantic search feature and organized and executed comprehensive code reviews to maintain high-quality standards.
The platform has revolutionized data communication, allowing businesses to integrate and publish dynamic, interactive statistics across various mediums, significantly enhancing their outreach and engagement.
Our technology stack includes Python, JavaScript, TypeScript, ElasticSearch, Tensorflow, Docker, Kubernetes, Google Cloud, AWS, MongoDB, Angular, scikit-learn, Transformers, git, and Jira.